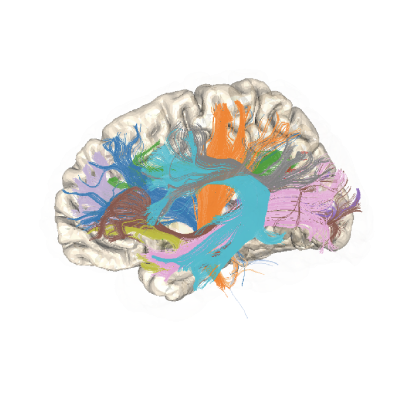
How to add new bundles into pyAFQ (Optic Radiations Example)#
pyAFQ is designed to be customizable and extensible. This example shows how you can customize it to define a new bundle based on a definition of waypoint and endpoint ROIs of your design.
In this case, we add the optic radiations, based on work by Caffara et al. [1], [2]. The optic radiations (OR) are the primary projection of visual information from the lateral geniculate nucleus of the thalamus to the primary visual cortex. Studying the optic radiations with dMRI provides a linkage between white matter tissue properties, visual perception and behavior, and physiological responses of the visual cortex to visual stimulation.
We start by importing some of the components that we need for this example and fixing the random seed for reproducibility
import os.path as op
import plotly
import numpy as np
import shutil

from AFQ.api.group import GroupAFQ
import AFQ.api.bundle_dict as abd
import AFQ.data.fetch as afd
from AFQ.definitions.image import ImageFile, RoiImage
import AFQ.utils.streamlines as aus
np.random.seed(1234)
Get dMRI data#
We will analyze one subject from the Healthy Brain Network Processed Open
Diffusion Derivatives dataset (HBN-POD2) [3], [4]. We’ll use a fetcher to
get preprocessed dMRI data for one of the >2,000 subjects in that study. The
data gets organized into a BIDS-compatible format in the ~/AFQ_data/HBN
folder:
study_dir = afd.fetch_hbn_preproc(["NDARAA948VFH"])[1]
Define custom BundleDict object#
The BundleDict object holds information about “include” and “exclude” ROIs,
as well as endpoint ROIS, and whether the bundle crosses the midline. In this
case, the ROIs are all defined in the MNI template space that is used as the
default template space in pyAFQ, but, in principle, other template spaces
could be used.
The ROIs for the case can be downloaded using a custom fetcher which saves the ROIs to a folder and creates a dictionary of paths to the ROIs:
or_rois = afd.read_or_templates()

bundles = abd.OR_bd()
Custom bundle definitions such as the OR, and the standard BundleDict can be combined through addition. To get both the OR and the standard bundles, we would execute the following code:
bundles = bundles + abd.default_bd()
In this case, we will skip this and generate just the OR.
Define GroupAFQ object#
HBN POD2 have been processed with qsiprep [5]. This means that a brain mask
has already been computer for them. As you can see in other examples, these
data also have a mapping calculated for them, which can also be incorporated
into processing. However, in this case, we will let pyAFQ calculate its own
SyN-based mapping so that the combine_bundle method can be used below to
create a montage visualization.
For tractography, we use CSD-based probabilistic tractography seeding
extensively (n_seeds=4 means 81 seeds per voxel!), but only within the ROIs
and not throughout the white matter. This is controlled by passing
"seed_mask": RoiImage() in the tracking_params dict. The custom bundles
are passed as bundle_info=bundles. The call to my_afq.export_all()
initiates the pipeline.
my_afq = GroupAFQ(
    bids_path=study_dir,
    dwi_preproc_pipeline="qsiprep",
    participant_labels=["NDARAA948VFH"],
    output_dir=op.join(study_dir, "derivatives", "afq_or"),
    tracking_params={"n_seeds": 4,
                     "random_seeds": False,
                     "directions": "prob",
                     "odf_model": "CSD",
                     "seed_mask": RoiImage()},
    bundle_info=bundles)

my_afq.export_all()
Visualize a montage#
One way to examine the output of the pyAFQ pipeline is by creating a montage of images of a particular bundle across a group of participants (or, in this case, the one participant that was analyzed).
Note
The montage file is copied to the present working directory so that it gets properly rendered into the web-page containing this example. It is not necessary to do this when running this type of analysis.
my_afq.combine_bundle("Left Optic Radiation")
montage = my_afq.group_montage(
    "Left Optic Radiation",
    (1, 1), "Axial", "left")
shutil.copy(montage[0], op.split(montage[0])[-1])
Interactive bundle visualization#
Another way to examine the outputs is to export the individual bundle figures, which show the streamlines, as well as the ROIs used to define the bundle. This is an html file, which contains an interactive figure that can be navigated, zoomed, rotated, etc.
bundle_html = my_afq.export("indiv_bundles_figures")
plotly.io.show(bundle_html["NDARAA948VFH"]["Left Optic Radiation"])